Longevity and VO2 max
Mandsager et al. (2018) quantify the strong relationship between VO2 max (a measurement of endurance fitness) and life expectancy. The relationship is so strong, in fact, that the hazard ratio between low and elite levels of VO2 max is greater than the hazard ratio of end stage renal disease. In simple terms, a great VO2 max is more associated with living a longer life than having healthy kidneys.
This interactive figure uses Garmin’s estimate of my VO2 max and extremely back-of-the-envelope calculations to estimate my life expectancy and how it changes with my training. See the GitHub Repository for how I process data from Garmin to create this chart.
Here is the back-of-the-envelope math that is used to create this figure. First, I take my VO2 max estimates from Garmin in units of mL/(kg $\cdot$ min). Garmin estimates VO2 max using wrist-based and cheststrap-based heart rate measurements during exercise and recovery. Wrist-based heartrate measurements are not very reliable. Nevertheless, Garmin VO2 estimates have been validated to accurately predict VO2 estimates from gold-standard laboratory tests. I then take a rolling average of VO2 estimates to smooth out any irregularities.
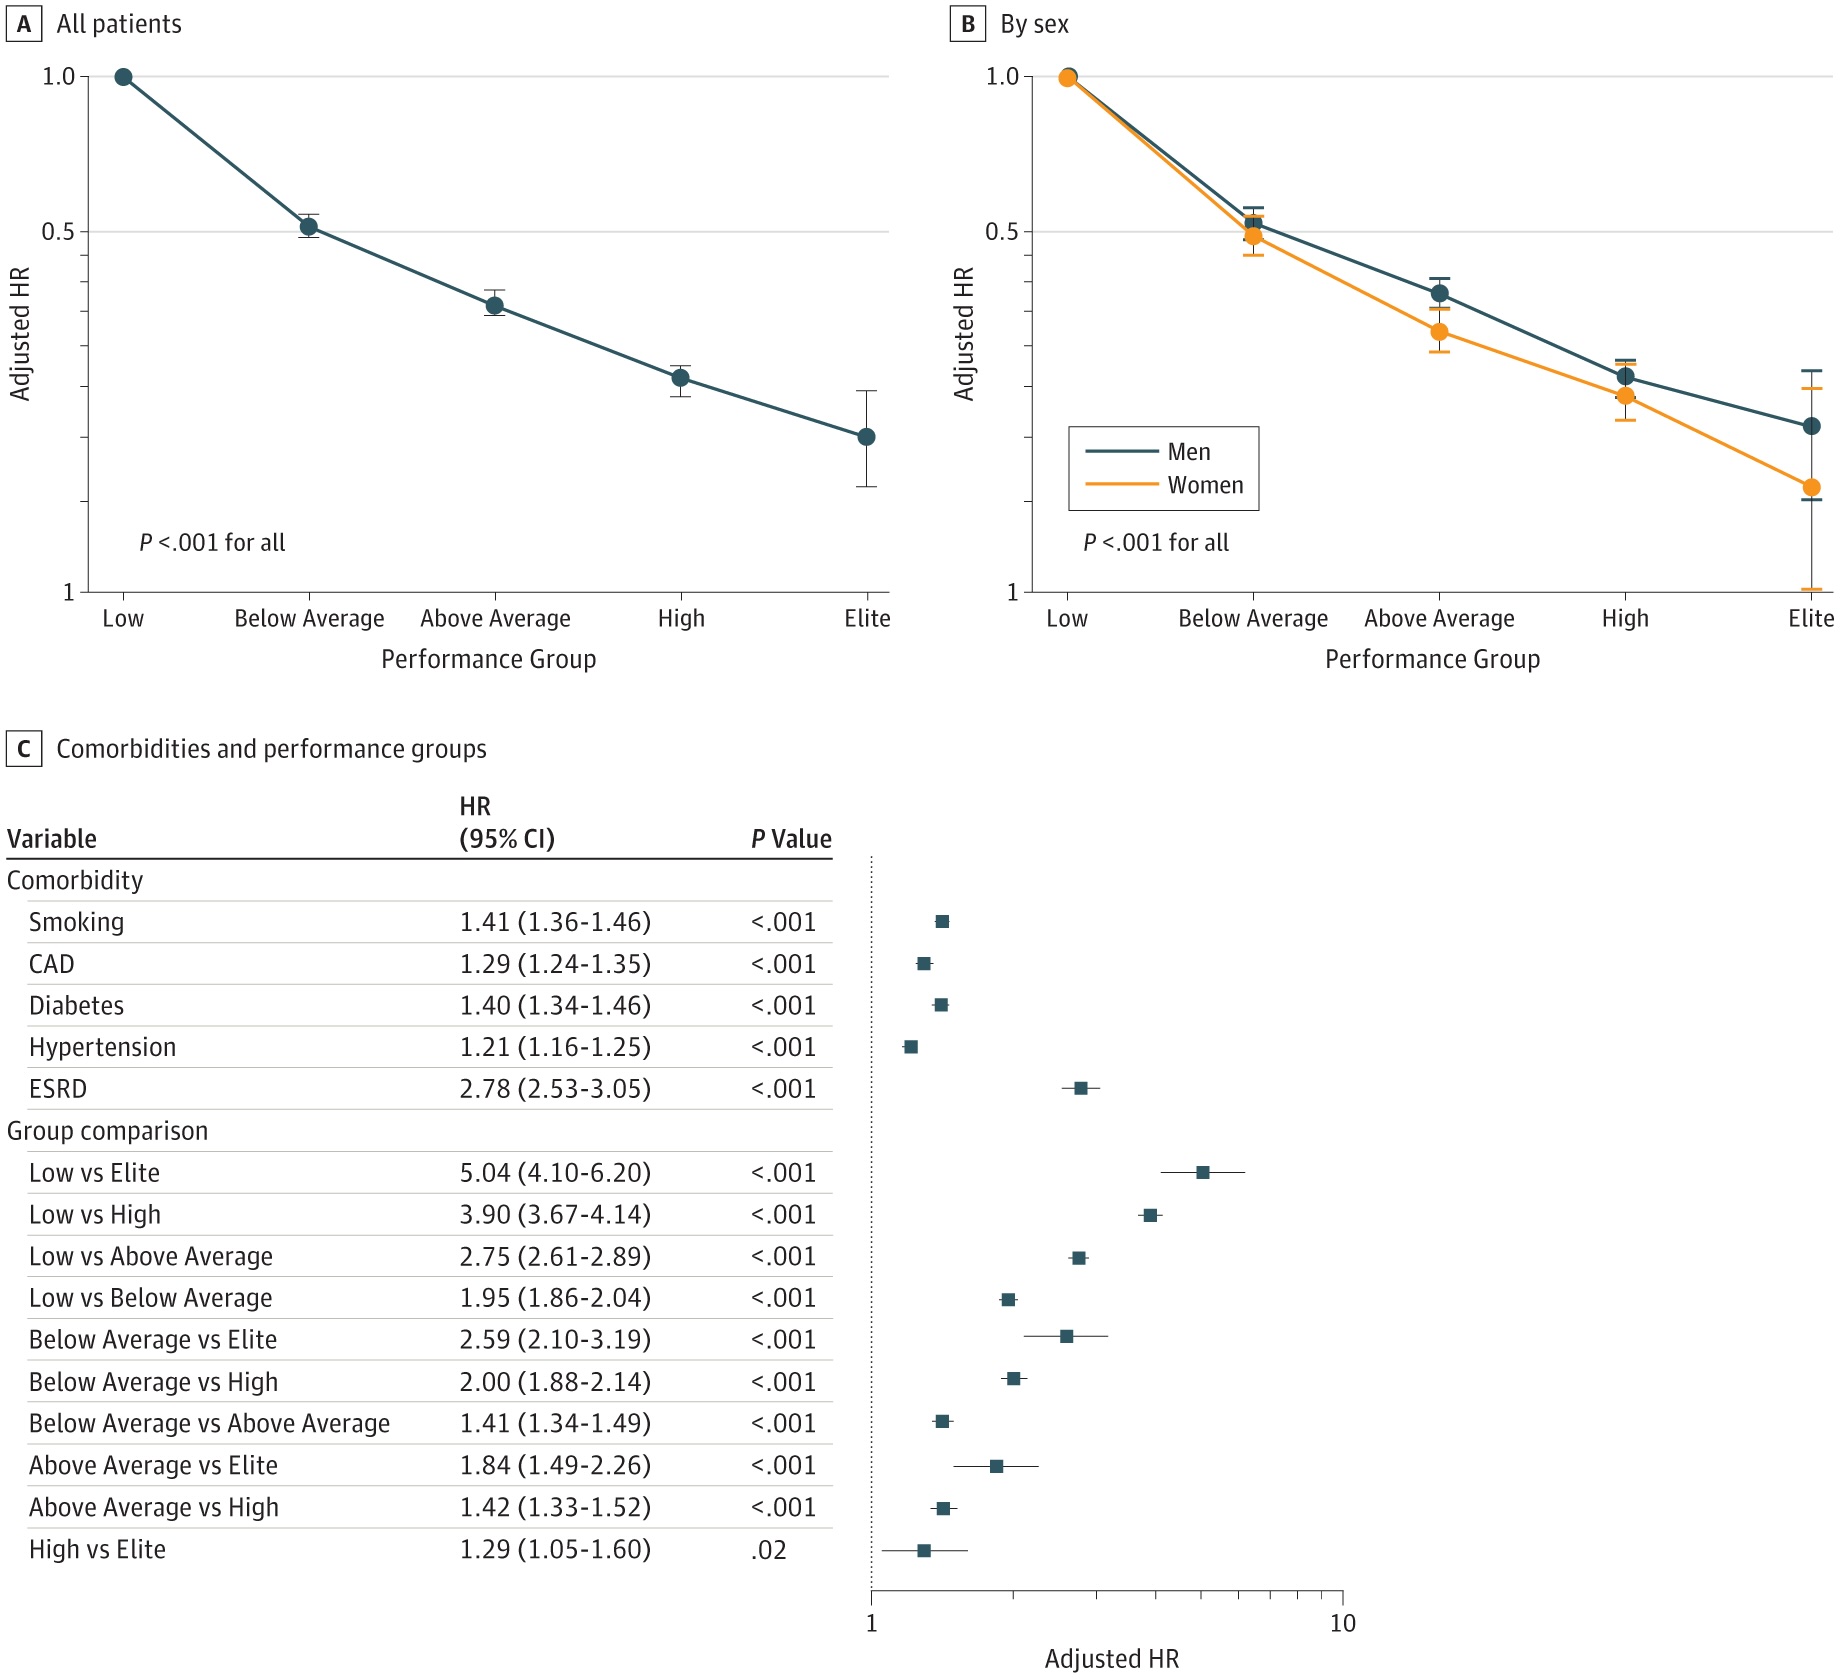
Each estimated value of VO2 max corresponds to a mortality hazard ratio relative to the median individual. For example, individuals with a high VO2 max will have a low hazard ratio (relatively less likely to die) while individuals with a low VO2 max will have a high hazard ratio (relatively more likely to die). The relationship between VO2 and hazard ratios are taken from Mandsager et al. (2018). The most important figure from this paper is shown below. I model the relationship between VO2 and hazard ratios as a natural cubic spline so that each estimate of VO2 corresponds to an estimated hazard ratio.
The next step is to use the hazard ratios to modify survival curves in order to estimate life expectancy. Mortality data by age and gender was taken from CDC Wonder from 2018-2021 in the United States (note that mortality was higher in 2020-2021 during the COVID-19 pandemic). These mortality data allow for the construction of survival curves from any age. Because this chart is taken over many years, this survival curve will be different in 2018 when I was 22 years old vs in 2023 when I was 27 years old. These baseline survival curves correspond to a hazard ratio equal to one for the average individual in the United States. Using the proportional hazards assumption, these survival curves will be pushed inward (less survival) or outwards (more survival) depending on whether the hazard ratio is greater than one or less than one.
Period life expectancy is calculated by integrating the survival curve. Higher VO2 max estimates correspond to a hazard ratio of less than one, and therefore more area under the survival curve. Therefore, higher VO2 max estimates correspond to greater life expectancy estimates.